ggastrum: Theme for ggplot2


This is an R Package for customizing the ggplot2 aesthetics.
Installation and Usage
library(remotes)
install_gitlab("culturalcartography/ggastrum")

# Basic setup (uses solaris theme and palette by default)
ggastrum::set_theme()
Themes
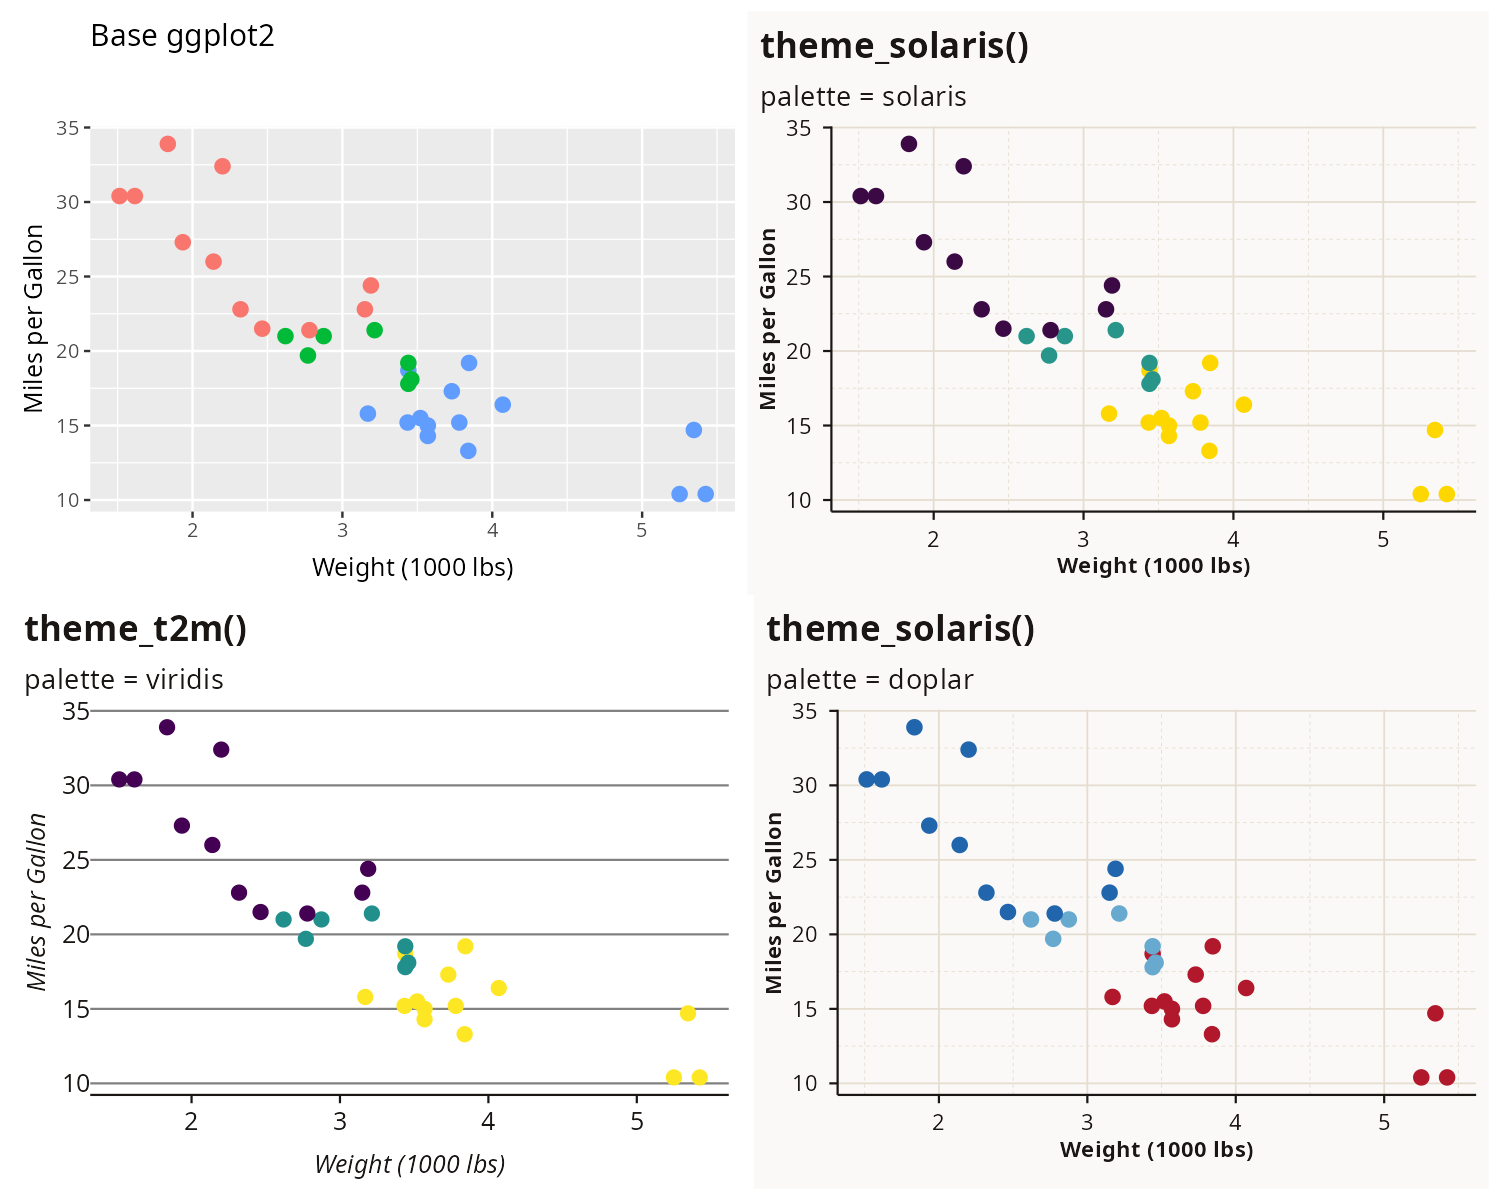
ggastrum provides two ggplot2 themes and five color palettes. The 2×2 grid below shows the same data under four configurations: base ggplot2 (top-left), solaris theme with solaris palette (top-right), t2m theme with viridis palette (bottom-left), and solaris theme with doplar palette (bottom-right).
Global Palette Options
ggastrum includes five palette options:
# Default: Solaris (blue-red warm palette)
ggastrum::set_theme(palette = "solaris")

# Viridis: Perceptually uniform (best for digital/accessibility)
ggastrum::set_theme(palette = "viridis")

# Inferno: Dark purple to bright yellow, perceptually uniform
ggastrum::set_theme(palette = "inferno")

# Grayscale: Best for textbook printing
ggastrum::set_theme(palette = "grayscale")

# Doplar: Blue-red diverging palette
ggastrum::set_theme(palette = "doplar")
Note: This setting applies globally to all subsequent ggplot plots.
Font Configuration
The package bundles Open Sans and Lato fonts for offline use. To enable these, set set_font = TRUE.
# Use Lato instead of default Open Sans
ggastrum::set_theme(set_font = TRUE, base_family = "Lato")
Rendering: Font rendering uses the showtext package for best cross-platform compatibility.
Utilities
Preview palettes with show_palette():
show_palette("solaris", n = 5)
show_palette(c("solaris", "doplar"), n = 7)
show_palette()  # all palettes
Highlight one category and fade the rest with scale_fill_highlight():
ggplot(mtcars, aes(factor(cyl), fill = factor(cyl))) +
  geom_bar() +
  scale_fill_highlight(highlight = "4")
Named accent colors for manual styling:
solaris_colors$purple  # "#2A0132"
doplar_colors$dark_red # "#b2182b"
Save plots with theme-aware defaults via save_plot():
p <- ggplot(mtcars, aes(wt, mpg)) + geom_point()
save_plot("myplot.png", p, width = 8, height = 6)
Quiet labels with geom_qlabel() — auto-repel and hide overlapping labels:
ggplot(mtcars, aes(wt, mpg, label = rownames(mtcars))) +
  geom_point() +
  geom_qlabel()
Contributions and Support
If you have any suggestions to improve this theme – especially for accessibility – send us an email (maintainers [at] textmapping.com) or submit pull requests.
Please report any issues or bugs here: https://gitlab.com/culturalcartography/ggastrum/-/issues