Overview
This article demonstrates how text2map.theme color
palettes work with network visualizations using the ggraph
package.
Network Data
We’ll use the classic Zachary Karate Club network.
set.seed(1701)
g <- igraph::make_graph("Zachary")

# Add node attributes
n_nodes <- igraph::vcount(g)
igraph::V(g)$name <- 1:n_nodes
igraph::V(g)$degree <- igraph::degree(g)
igraph::V(g)$community <- igraph::membership(igraph::cluster_louvain(g))
n_communities <- length(unique(igraph::V(g)$community))

# Convert to tidygraph for ggraph
tbl_g <- tidygraph::as_tbl_graph(g)
Continuous Attributes
Degree Centrality
set.seed(1701)

ggraph(tbl_g, layout = "fr") +
  geom_edge_link(alpha = 0.4, edge_width = 0.5) +
  geom_node_point(aes(color = degree, size = degree)) +
  scale_size_continuous(range = c(3, 8), guide = "none") +
  scale_color_gradientn(colors = solaris_pal(10)) +
  labs(
    title = "Zachary Karate Club",
    subtitle = "Node color and size by degree centrality",
    color = "Degree"
  ) +
  theme(legend.position = "right")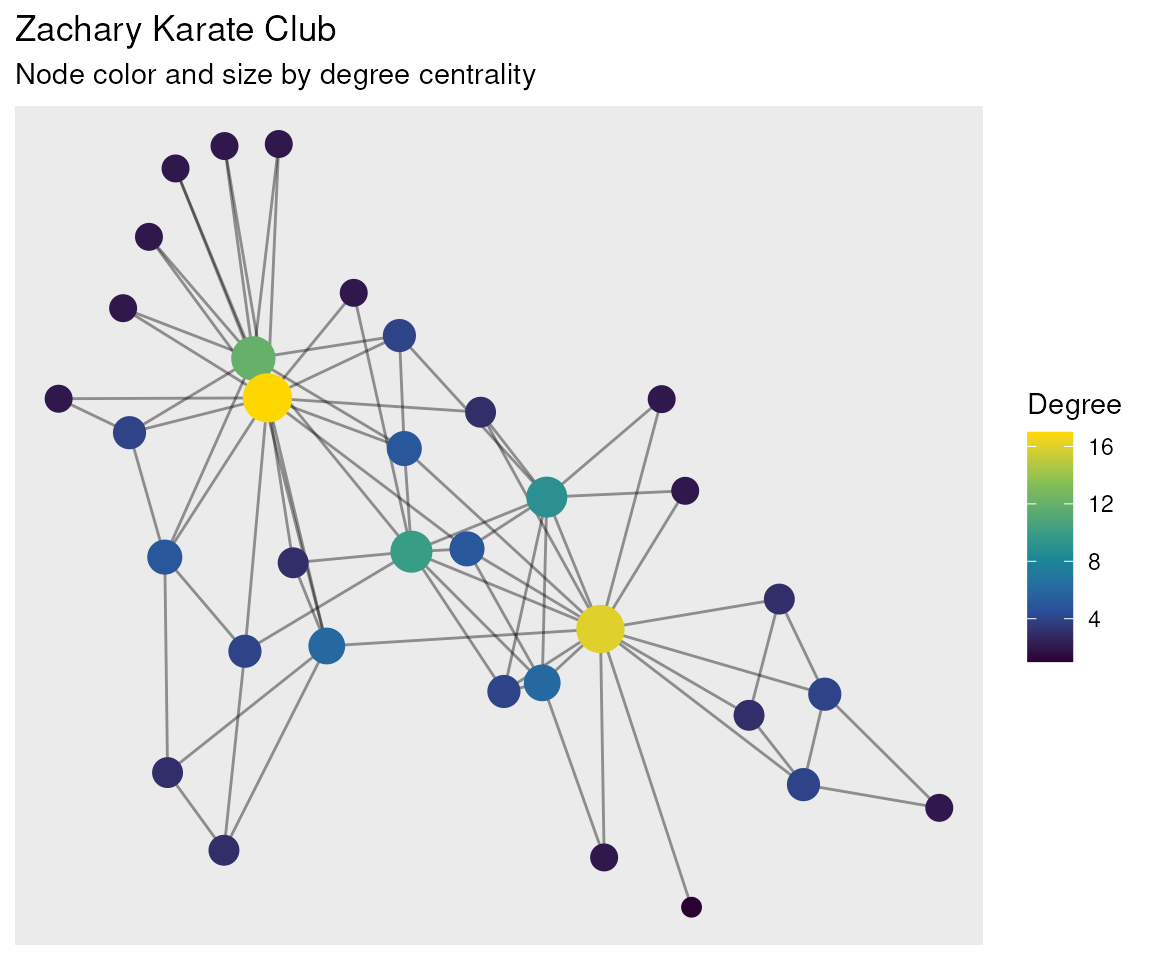
Discrete Attributes
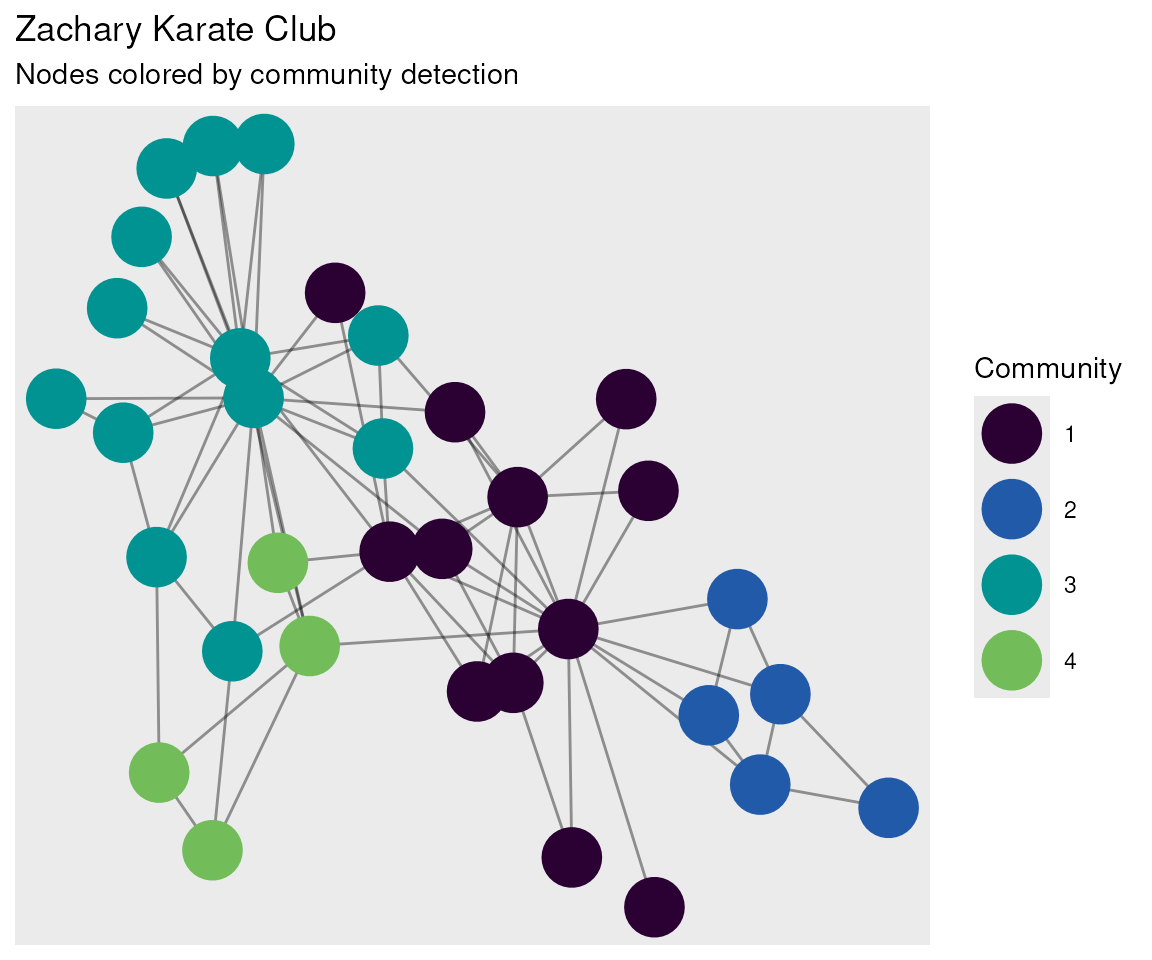
Community Detection
The solaris discrete palette provides distinct colors for categorical groups.
set.seed(1701)

# Detect number of communities
n_communities <- length(unique(igraph::V(g)$community))

ggraph(tbl_g, layout = "fr") +
  geom_edge_link(alpha = 0.4, edge_width = 0.5) +
  geom_node_point(aes(color = factor(community)), size = 10) +
  scale_color_manual(values = solaris_pal(n_communities)) +
  labs(
    title = "Zachary Karate Club",
    subtitle = "Nodes colored by community detection",
    color = "Community"
  )
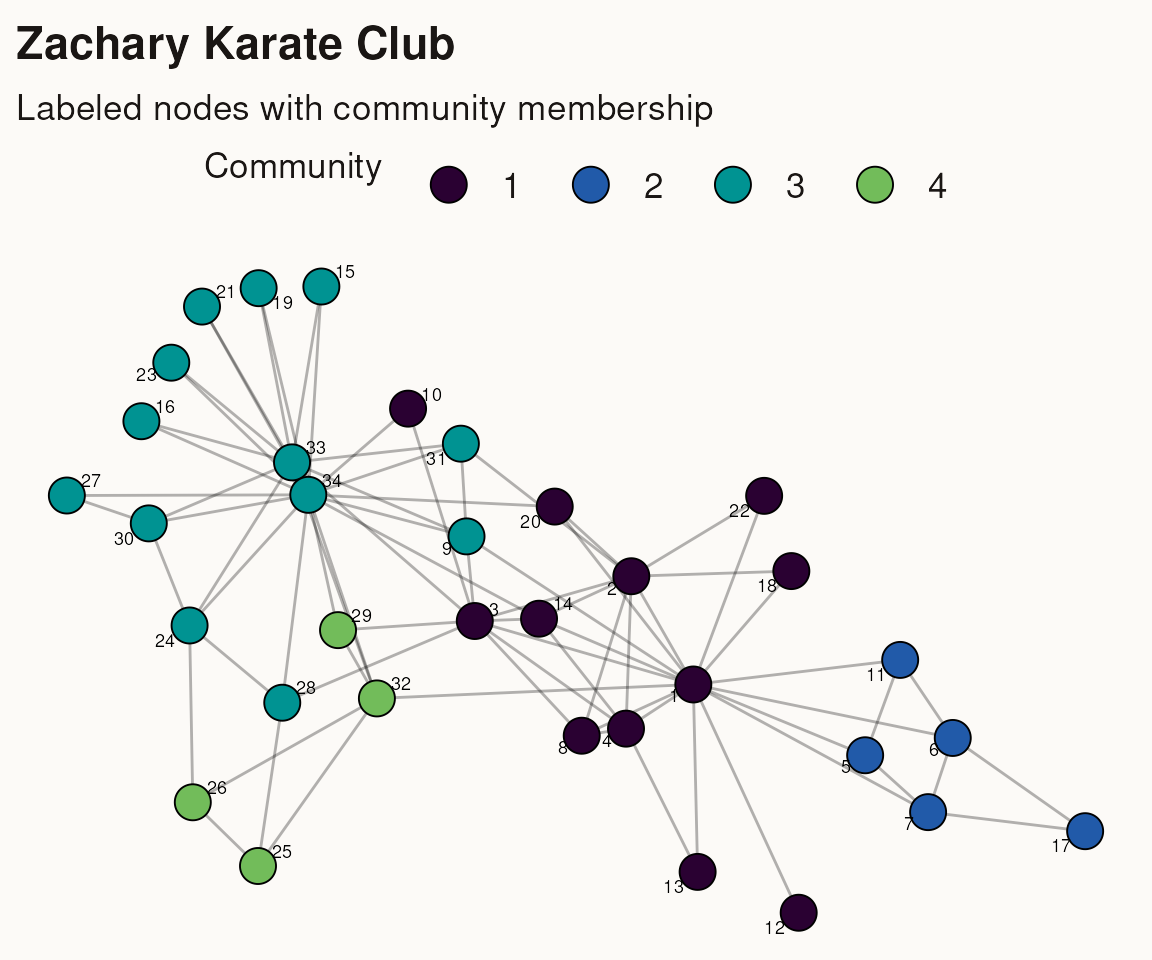
Theme Solaris for Networks
The theme_solaris() function provides a cream background
that works well for network visualizations.
set.seed(1701)

ggraph(tbl_g, layout = "fr") +
  geom_edge_link(alpha = 0.3, edge_width = 0.5) +
  geom_node_point(aes(fill = factor(community)), shape = 21, size = 6, stroke = 0.5) +
  geom_node_text(aes(label = name), repel = TRUE, size = 2.5) +
  scale_fill_manual(values = solaris_pal(n_communities)) +
  theme_solaris() +
  labs(
    title = "Zachary Karate Club",
    subtitle = "Labeled nodes with community membership",
    fill = "Community"
  )
Summary
Key functions for network visualizations:
-
solaris_pal(n)- Generate n colors from the palette -
scale_fill_solaris_d()- Discrete fill scale for ggraph -
theme_solaris()- Cream background theme (auto-detects ggraph plots)
The palette works well with both continuous attributes (via gradient) and discrete attributes (via manual scale).