Overview
text2map.theme provides custom ggplot2 themes and color
palettes designed for academic publications and presentations. The
package includes two themes (theme_t2m() and
theme_solaris()) and four color palettes (viridis, inferno,
grayscale, solaris).
Quick Start
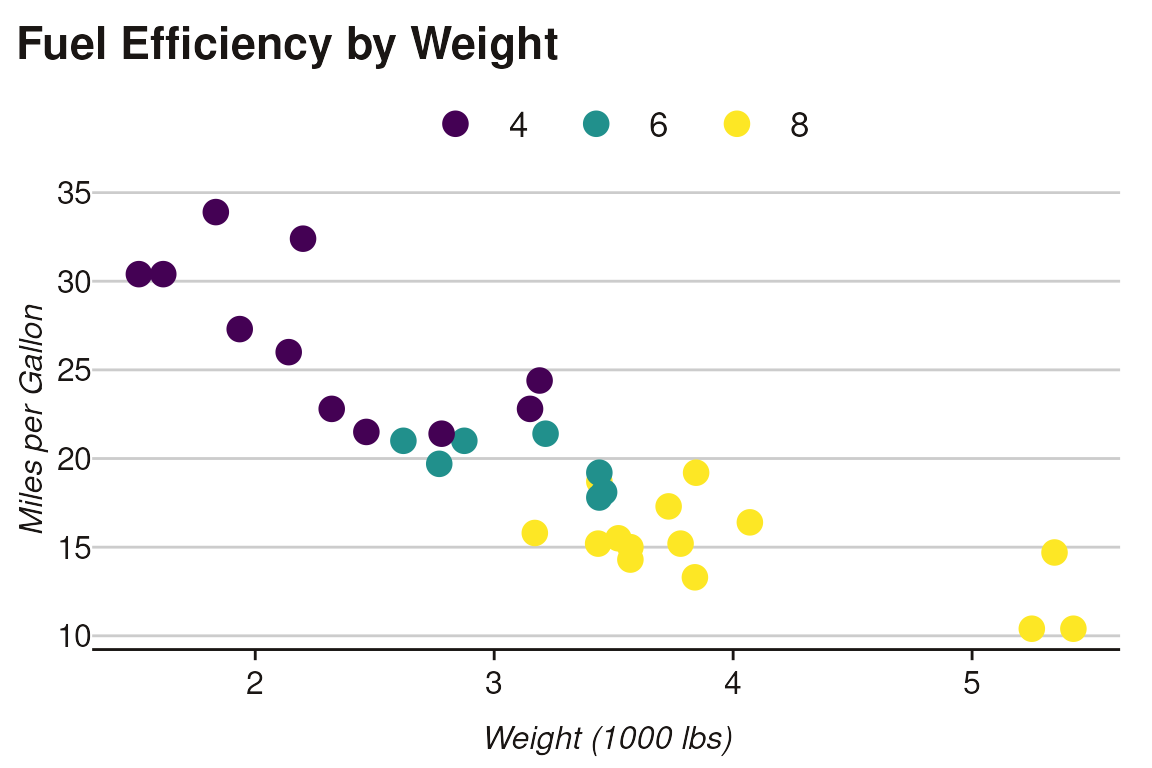
The simplest way to use the package is with set_theme(),
which configures the global ggplot2 theme and color palette:
# Set up the theme (uses viridis palette by default)
set_theme()

# Create a plot - theme and colors are applied automatically
ggplot(mtcars, aes(wt, mpg, color = factor(cyl))) +
 geom_point(size = 4) +
 labs(
    title = "Fuel Efficiency by Weight",
    x = "Weight (1000 lbs)",
    y = "Miles per Gallon",
    color = "Cylinders"
  )
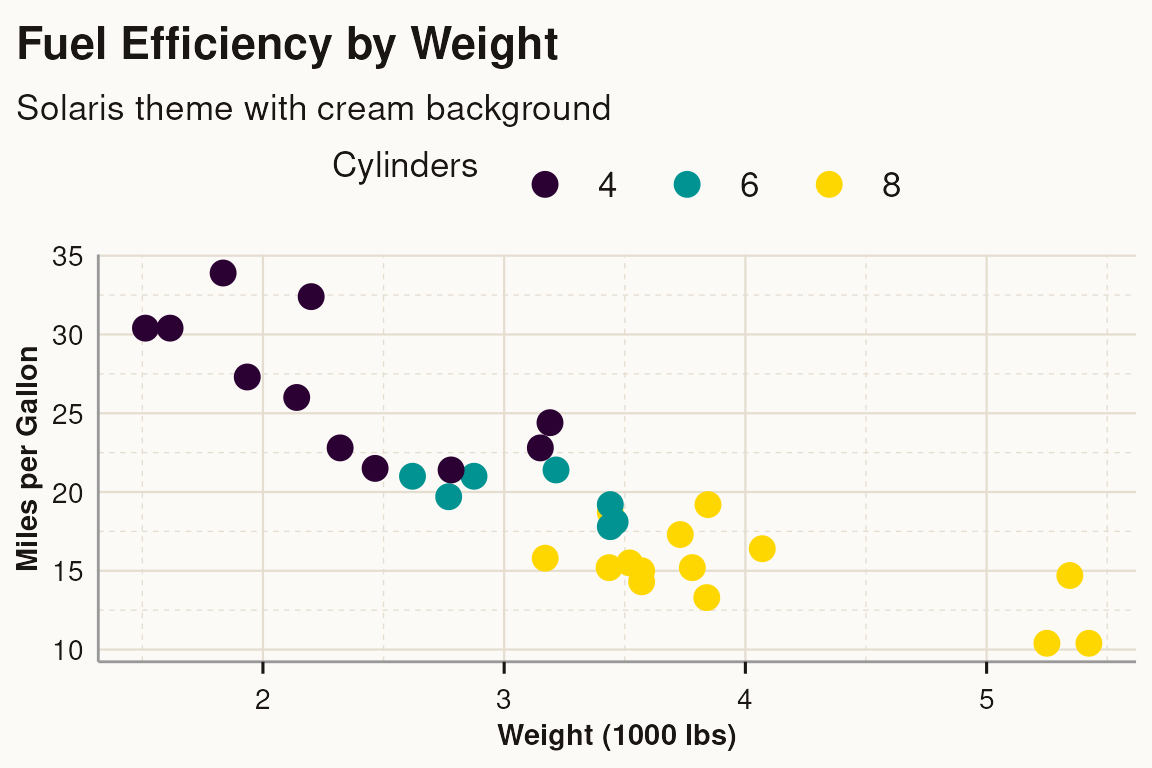
Solaris Theme
For a warmer aesthetic with a cream-colored background, use
theme_solaris():
ggplot(mtcars, aes(wt, mpg, color = factor(cyl))) +
  geom_point(size = 4) +
  scale_color_solaris_d() +
  theme_solaris() +
  labs(
    title = "Fuel Efficiency by Weight",
    subtitle = "Solaris theme with cream background",
    x = "Weight (1000 lbs)",
    y = "Miles per Gallon",
    color = "Cylinders"
  )
Font Configuration
The package bundles Open Sans, Lato, and Source Sans 3 fonts for
offline use. To enable custom fonts, set
set_font = TRUE:
# Use bundled Open Sans font (default)
set_theme(set_font = TRUE)

# Use Lato instead
set_theme(set_font = TRUE, base_family = "Lato")

# Use Source Sans 3
set_theme(set_font = TRUE, base_family = "Source Sans 3")
For legacy systems, you can use the extrafont backend
instead of the default showtext:
set_theme(set_font = TRUE, font_method = "extrafont")Learn More
For more detailed documentation, see the following articles:
- Color Palettes: Compare viridis, inferno, grayscale, and solaris palettes for discrete and continuous scales
-
Theme
Comparison: Side-by-side comparison of
theme_t2m()andtheme_solaris(), plus print optimization - Base R Plots: Using text2map.theme palettes with base R graphics
- Network Visualization: Using themes and palettes with ggraph network plots